

Announcing: Attribution & Reporting Enhancements
New Ways to Compare, Analyze, and Optimize Your Campaigns
Attribution isn’t just about tracking conversions—it’s about understanding what’s working and why.
That’s why we’ve launched two major updates designed to help you break down campaign performance in new ways:
Performance by Buy Type – Compare campaign results by how your media was purchased.
CPA & ROAS Reporting – Get a clearer breakdown of acquisition costs and return on ad spend by key segments.
Both of these updates give you deeper insights into your ad performance, making it easier to refine strategy and maximize results.
Performance by Buy Type: See Which Buying Strategies Deliver the Best Results
Not all campaigns perform the same way and different buying strategies—whether dynamic ad insertion (DAI), episodic buys, or network placements—affect performance in different ways.
With the new Buy Type tab, you can now aggregate and compare campaign performance based on buy type, making it easier to assess which strategies deliver the best ROI.


What You Can Analyze
Media Type (e.g., podcast vs. streaming)
Buy Type (e.g., DAI vs. impression-based)
Ad Length (e.g., 30s vs. 60s)
Placement (e.g., pre-roll vs. mid-roll)
Custom Tags (e.g., initiative, product, or campaign grouping)
Instead of manually pulling reports to compare different buys, this tab provides a structured, automated view of performance trends—helping you optimize spend at a high level.
How This Helps You Optimize Campaigns
By tracking performance trends at the buy type level, advertisers can now:
Identify the most effective buying strategies and adjust spend accordingly
Eliminate inefficiencies by understanding which approach drives stronger conversions
Make data-driven media buying decisions with clear side-by-side comparisons
With one simple view, you can quickly spot trends, refine your strategy, and focus budget on the buying methods that drive the best results.
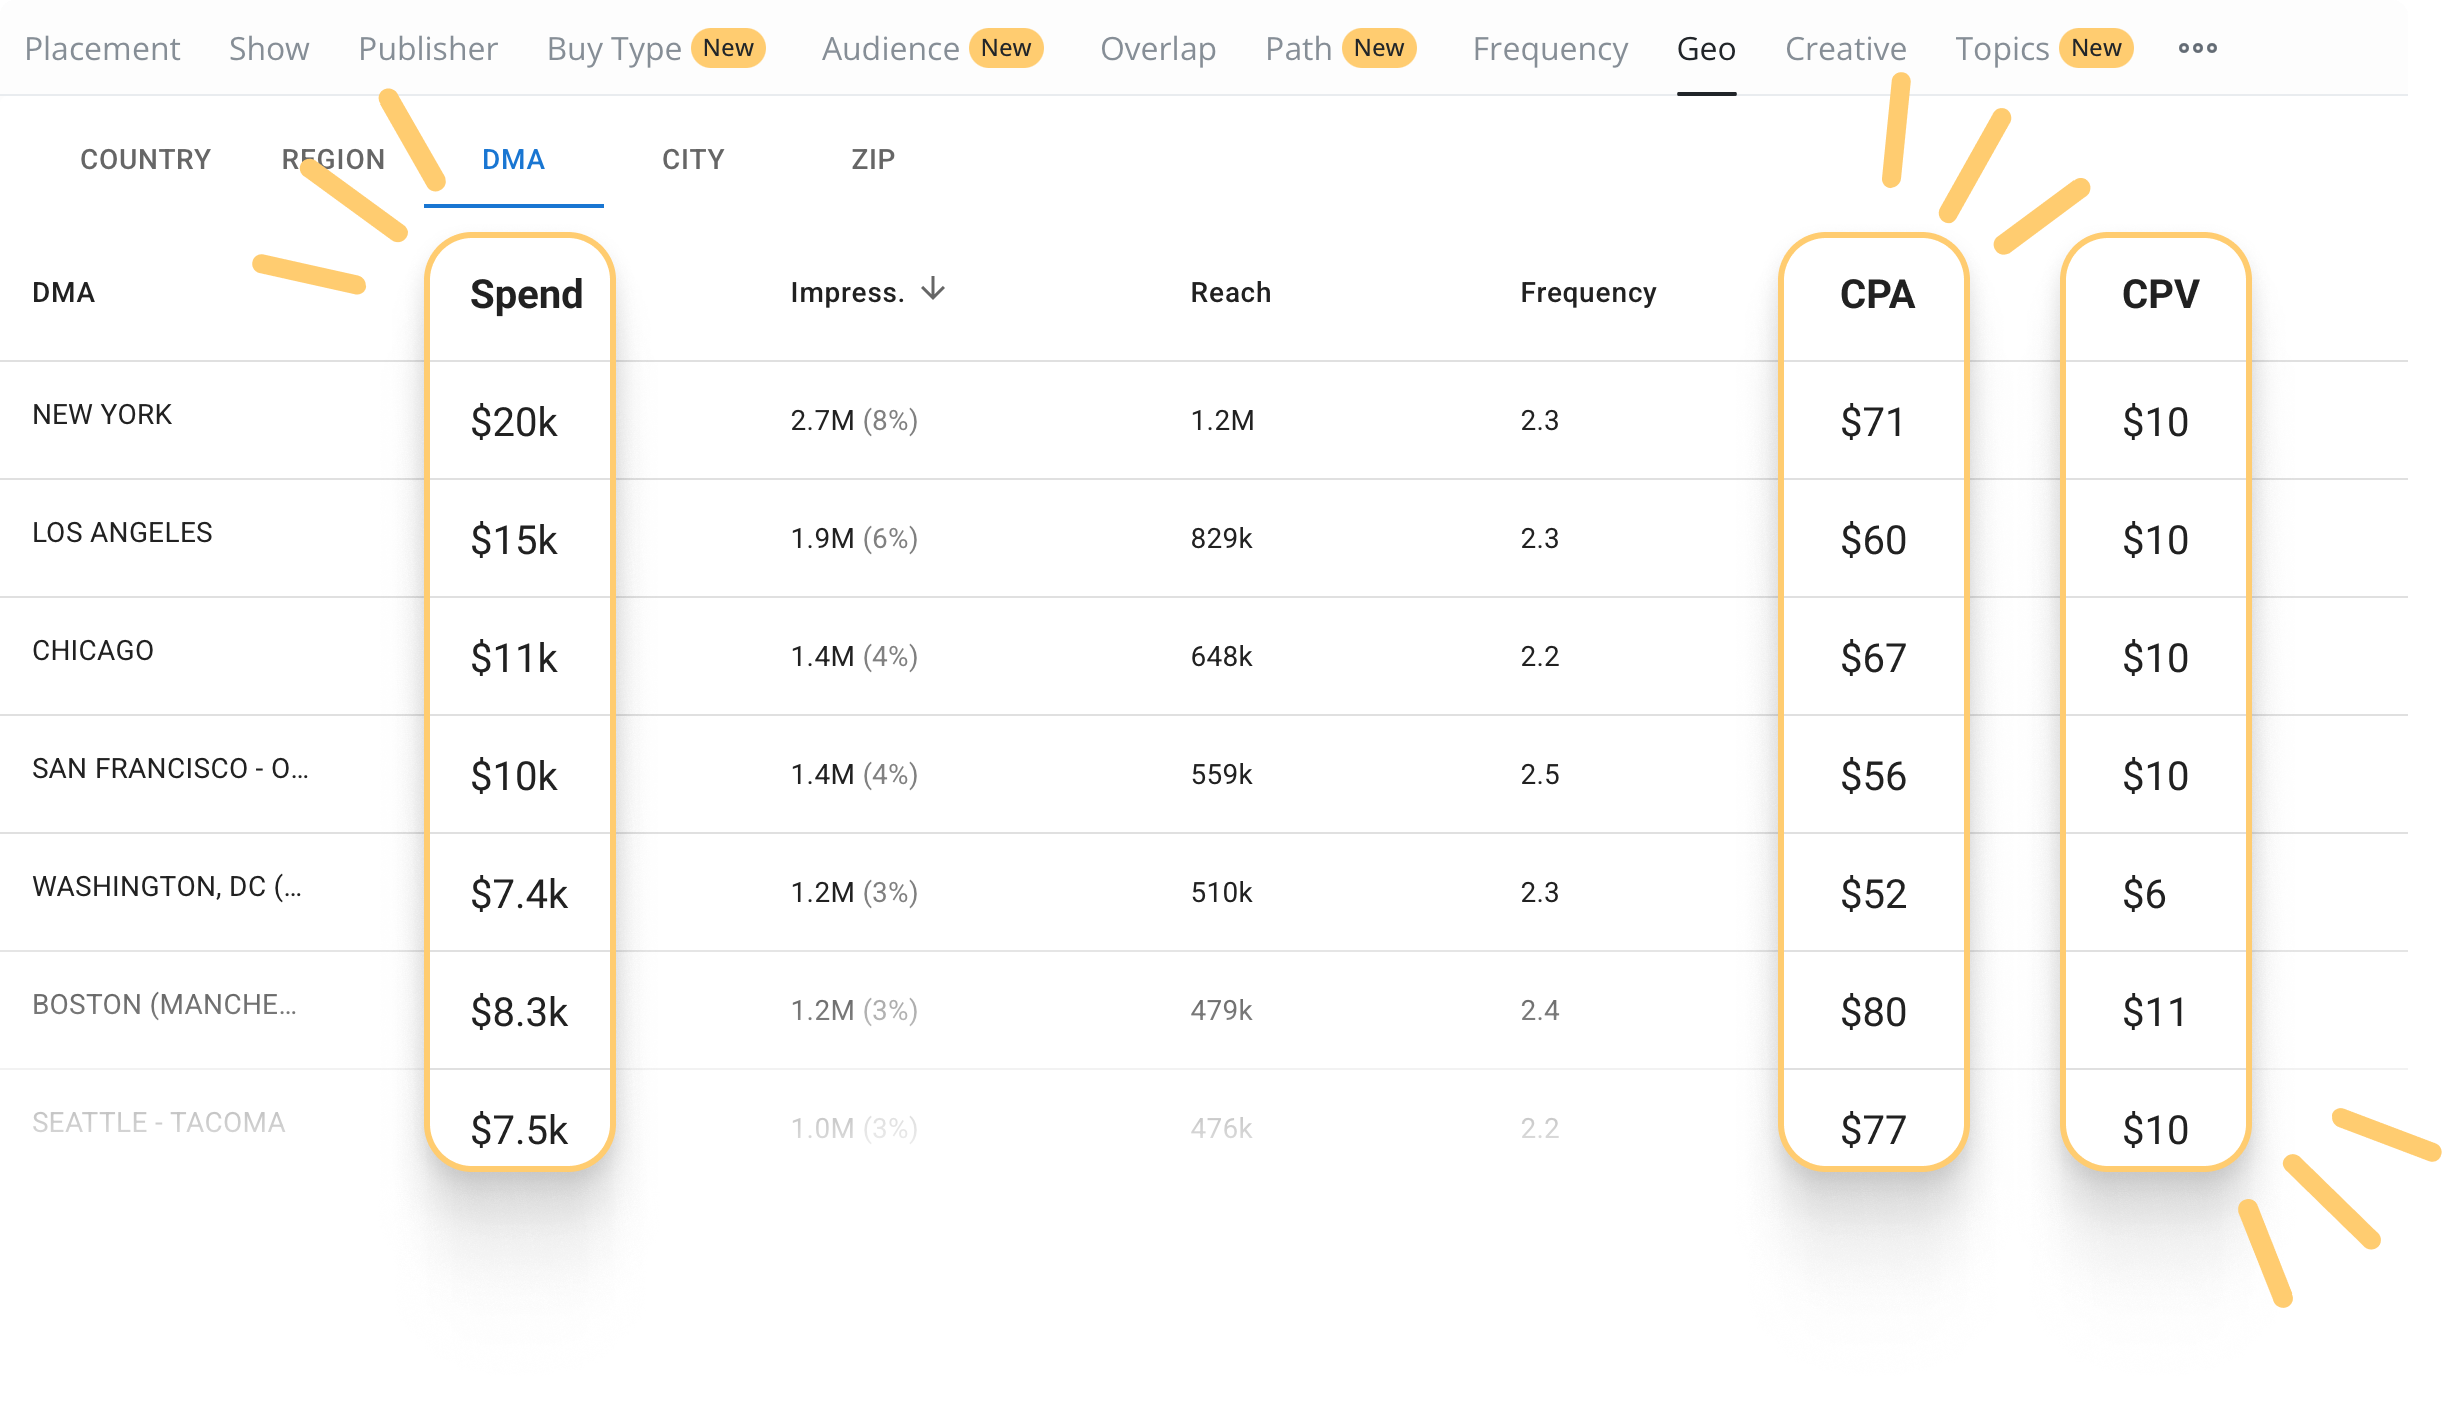
CPA & ROAS Reporting: See Performance Per Dollar
Measuring conversions is important, but understanding how efficiently your budget is driving results is what truly matters. That’s why Podscribe now applies spend data across all overview tables—so you can see CPA and ROAS across every data cut, including location (DMA), category, creatives, and buy type efficiency, giving you a clearer picture of where your budget delivers the best return.
Why This Matters
Previously, advertisers had to manually calculate CPA per DMA using campaign-level spend data. Now, Podscribe automatically attributes spend across every segment, making it easier to:
Track CPA & ROAS across different segments like location, category, creatives, and buy type
Compare efficiency at a granular level to see where budget delivers the best return
Move beyond conversion rates to evaluate true cost efficiency

How This Helps You Optimize Campaigns
This update makes it simple to analyze performance per dollar spent, giving advertisers the insights they need to shift budgets strategically and optimize spend allocation. By shifting from impression-based performance to cost-based performance, advertisers can now:
Spot high-efficiency markets and allocate more budget to regions that convert at lower costs
Compare creative performance and refine messaging based on cost per conversion, not just engagement metrics
Evaluate buy types more effectively, understanding which approach delivers stronger ROI
See It in Action
These features are now available in your Podscribe dashboard. If you have any questions or want a walkthrough, our team is happy to help.
For more details, reach out to adops@podscribe.com.